Do Small Cap and Value Stocks Outperform After Market Crashes? : April 16, 2020
According to research by Nobel Laureates Eugene Fama and Ken French, small cap and value stocks have historically outperformed the market. That has not been the case for U.S. stocks in recent years, as large cap outperformed small, and growth outperformed value. A question we often get from clients is whether we might see a snap back where small cap and value stocks outperform as we come out of the current bear market.
The reality is that no one can predict the future of financial markets with any degree of certainty or consistency. What we can do, however, is reflect on what has happened in the past, how stocks performed after previous downturns, and draw historical probabilities to guide our expectations. So what has happened following previous downturns? First, a quick review of definitions:
Small cap refers to small companies as measured by market capitalization, or a company’s stock price multiplied by shares outstanding. Small cap companies are typically worth $300 million to $2 billion, while in contrast large cap companies are worth $10 billion or greater. Think Shake Shack worth $1.2 billion vs. McDonalds worth $120 billion.
Value stock represents a company that trades at a low price relative to its fundamentals, such as its book value. An example of a value stock is Exxon Mobile, which trades at less than 1x its book value, while Facebook which trades at nearly 5x its book value is considered a growth stock.
These two groups can be subdivided further. Companies that share characteristics of both small and value are referred to as small cap value stocks. An example here is Skywest, which is worth $1.3 billion and trades at less than 1x its book value. Conversely, Facebook has characteristics of both large and growth, and is thus considered a large cap growth stock.
In a recent study, Verdad Capital looked specifically at times in the last 50 years where U.S. stocks fell by more than 20% from peak, like they did in March, and analyzed the 12- and 24-month returns after each drop. In each instance they measured returns starting 3 months after stocks crossed the -20% threshold. Here’s what they found.
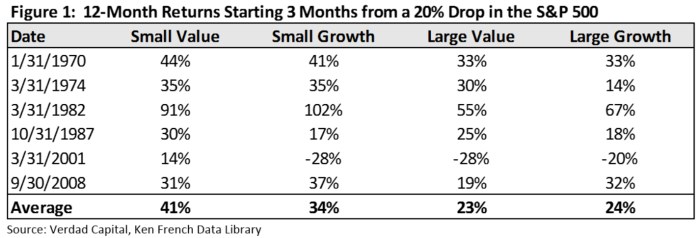
After 12 months, small cap value returned an average premium of 7% over small cap growth (premium is how we refer to the difference in performance, or 41% vs. 34%), and at least a 17% premium over the large cap categories. Within large cap, there was only a marginal difference between value and growth.
What’s notable about small cap value is that it outperformed small cap growth in only half the instances, but when it did outperform it did so by a wider margin than the times it underperformed. Small value’s worst premium relative to small growth was -11% after 1982 (91% vs. 102%), while its best was +42% following 2001 (14% vs. -28%).
What about after 24 months? Things improve a bit more for small cap and value.
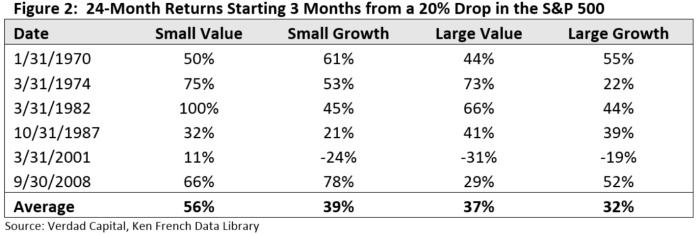
Over the 24-month period, small value again produced the strongest average performance, with a +17% premium over small growth, and between a 19% and 24% premium over the large cap categories. This time large value also had a positive premium of 5% over large growth.
What’s notable in this period is that small value again didn’t beat small growth every time, but when it did the premium was often big. Small value’s worst premium relative to small growth was -12% after 2008, while its best was +55% after 1982. This time we also see a similar relationship in the large cap category, where large value’s worst premium relative to large growth was -23% after 2008, while its best was +51% after 1974.
There are a few things to take away from the research.
- There evidence supports that small cap and value stocks tend to outperform following stock market downturns of at least -20%.
- This outperformance has not happened after every downturn. Take the period following the financial crisis in 2008, when both small and large value underperformed their growth counterparts.
- When we did see outperformance of small cap and value, these premiums are often quite large and occur over a relatively short time periods. Take for example the 24-month period following 1982 when small growth returned 45% while small value returned 100%.
Another highlight from Verdad’s research is that small cap and value stocks today are historically cheap, suggesting a higher likelihood of outperformance when things return to normal. Using the measure of price to cash flow, value stocks are roughly 22% cheaper than in 1999 and 42% cheaper than in 2008.
When reviewing historical probabilities like the above, clients sometimes ask whether they should dial up their exposure to small cap and value in times like these. I usually recommend that they don’t. While there has been some correlation between market cycles and the performance of small cap and value, research suggests that timing these factors is hard, and can hurt performance. A better approach in our view is to decide on your exposure to small cap and value within your asset allocation, and then maintaining that level of exposure over the long term.
Again, no one can predict the future of financial markets, and there is no way to know what the timing or the dynamics of a recovery in stocks will be. I think that is true now more than ever as we face a global biological crisis, a global economic shutdown and trillions in government stimulus – a combination of conditions we’ve never before seen.
Yet we would be remiss if we didn’t look back at history, and use what’s happened in the past to guide our expectations about the future. Looking back at how small cap and value stocks performed following previous market crashes, I certainly wouldn’t want to bet against them now.